Coronavirus Correction: How Far?

So how far will the U.S. stock market fall as the fear of a coronavirus pandemic tightens its grip on daily trading activity? Since there is no way to know, there is little sense to making a prediction on that front. But that does not mean that we cannot set our expectations based on market history, even if there are no assurances that the actual result will be no worse than said expectations.

Without full blown recessions, market corrections are typically in the 10-20% range. Today I updated a graphic that I had last posted on this blog in early 2016, which summarizes recent corrections in the S&P 500 index. The data now goes back 10 years:

SPXCorrections 2010-2020.png

If the virus starts to slow in the coming days and weeks, the market might stabilize soon, whereas an acceleration will stoke more fear and likely result in moving towards that 20% threshold. A full blown global recession puts 20-40% declines on the table based on historical data.

Editor’s Note (3/6/20): To put these levels into perspective, the S&P 500 peaked on 2/19/20 at 3,393. Corresponding corrections are as follows: -10% (3,054), -15% (2,884), and -20% (2,715). The low point reached so far during the virus-induced market decline was 2,856 (-16%) on 2/28/20.

I have no idea how this virus will play out. If we look at SARS from the early 2000’s, the 10-20% range was adequate and assets rebounded quite quickly. The same is true of the zika, ebola, swine flu, and bird flu outbreaks. An important aspect of investing is using historical data to inform probability-based decisions. Without a crystal ball, all we can really do is try and stack the deck in our favor as much as we can with that data and prior experience.

All in all, my inclination is to buy quality companies on sale, expect that the market decline will mimic those of the last decade, and take a multi-year view on my investments as things get back to normal. While there are no guarantees that strategy will play out as I expect, making an alternative bet of some kind does not have a better chance of success based on market and economic history, which means I have little interest in exploring such paths.

When my clients reach out and ask if I am worried, my simple answer is “no.” Barring a permanent material change in how we live our lives, or how many people there are to fuel the global economy, the economic and financial output of the corporate sector is likely to snap back after a number of months, in which case the market will move on and look ahead to the future.

As 2020 Begins, Low Volatility and Investor Complacency Warrants Some Caution

As the new year has begun the same way the prior one ended (a slow melt-up in stock prices without much in the way of concern from any corner of the market), I can't help but get the feeling that complacency is extremely elevated and investors are mostly bullish.

Can the U.S. equity market keep up this trajectory:

Can market volatility remain this benign, as the Wall Street Journal reported this morning:

"The S&P 500 is in one of its longest streaks without a 1% daily move in the past five decades, highlighting how the latest leg of the stock-market rally has been a gradual climb rather than a euphoric surge. The broad equity gauge hasn’t moved 1% or more in either direction since mid-October, its sixth-longest streak since the end of 1969 and third-longest since the end of 1995, according to Dow Jones Market Data. Driving the extended period of calm trading: An initial U.S.-China trade deal and lower interest rates around the globe that have eased fears of a sharp economic slowdown."

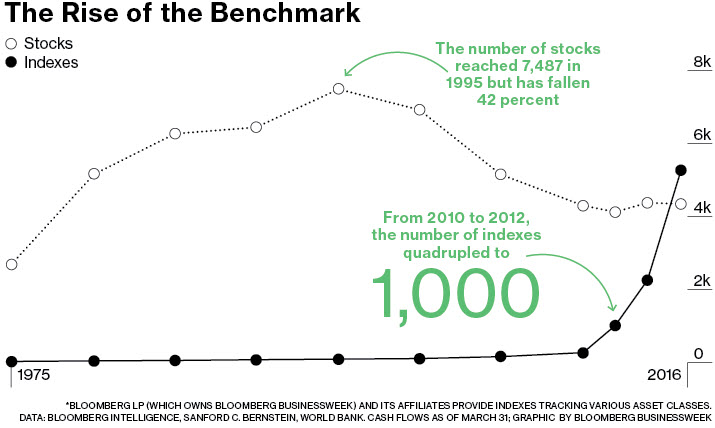
A big indicator of investor complacency continues to be the popularity of index funds. The sheer number of indexes being created should give us all pause. Consider the following two stats:

1) As of the end of 2017, there were more than 3 million stock market indices worldwide, more than 70 times more than the number of public companies (43,000).

2) The story is similar in the U.S. alone: as of 2016, there were about 4,000 U.S. stocks but more than 5,000 indices containing them, according to Bloomberg:

While I don't have updated data, it is safe to assume the gap is even wider now that a few years has passed and the trend is not slowing down. It boggles the mind, really. Imagine a professional sports league with more teams than actual players. It is just not logical.

After a decade where the main index, the S&P 500, posted 14% average annual returns, it is easy to see how recency bias is forcing investors to conclude that indexing is the only strategy worthy of consideration. But let's not forget that the markets are cyclical, just like the economy and investor sentiment. With the P/E on the market now above 20x, a level that historically has warranted caution, and the 5 largest stocks now comprising nearly 20% of the S&P 500's market value, there are real signs that investors have set everything to auto-pilot and expect the tech sector to continue to drive the indices higher indefinitely.

All of these factors taken together make me nervous. That is not to say that it has top end soon and in dire fashion (there are plenty of plausible outcomes), but I would not want to make a strong consensus bet that the next 1-0 years will look similar to the last 10.

Guess The Valuation - Inaugural Edition

As a fundamentally and valuation driven investor, I am continuously amazed at some of the equity valuations the public market bestows on growth companies, even in an age of near-zero interest rate borrowing conditions.

So for those valuation-driven readers, let me present the first of what I will simply call "guess the valuation." I present you with financial metrics and you tell me how much you think a growth investor, at most, should be willing to pay in total equity market capitalization terms.

Before the comments start coming, understand that I am fully aware that this exercise is overly simplistic and one would want to have more data before answering such a question. Humor me please to play along, and feel free to give the company below the benefit of the doubt (within reason).

Unidentified Company X

Financial results for the first 9 months of 2019

Revenue: $1 billion (+50% yoy)

Gross Profit: $600 million (+50% yoy)

R&D Expenses: $250 million (+50% yoy)

Marketing Expenses: $350 million (+35% yoy)

General/Admin Expenses: $125 million (+60% yoy)

Operating Loss: $125 million (-35% yoy)

Operating Cash Flow: $20 million (N/M)

Okay, guess the equity value assuming zero net debt on the balance sheet...

The IPO Market Has Taken The Baton From Large Cap Tech And Is Running Like Crazy

For several years until recently large cap technology companies were carrying the U.S. stock market on their backs. The nickname of FANG was even coined to describe the group, which included Facebook, Apple, Netflix, and Google. However, all of those companies saw their stock prices peak in 2018 and move in sideways fashion since, which has resulted in the S&P 500 doing the same over the last year:

SPX12m.png

With the tech sector comprising more than 30% of the S&P 500, as big tech stocks see their rapid ascents halted, so does the overall market...

However, with the economy doing well and stocks having rebounded from their Q4 2018 swoon, there are going to be pockets of strength in the market regardless. For a while it was cannabis stocks but now it appears to be the IPO market.

While the valuations are not as extreme as they were in 1998-2000 with the tech bubble, they nonetheless don't jive with the underlying financial profiles of the companies. Beyond Meat, which will wind up being among dozens of alt-meat competitors, should not be valued at $10 billion (for example). Unlike high margin tech companies like Facebook or Google, traditional businesses like food manufacturing or general merchandise retail have low margins and therefore will not result in large price-to-sales multiples over the long term.

I bring up the latter category because today's IPO winner du jour is online pet store Chewy.com (CHWY), which price its IPO at $22 per share and nearly doubled to more than $41 before 11:30am ET. At that price, CHWY's market value is $17 billion.

Chewy is growing very fast and could very well reach $5 billion in annual sales this year. That sounds great, and at a tad over 3 times annual sales, maybe the stock is not mispriced? Well, let's not forget that Chewy sells pet food online and ships it to their customers. This is not a revolutionary business model, and it certainly is not cheap to operate. Cost of goods for Chewy is above 75% and operating margins are negative. If the company decided to grow more slowly and cut marketing expenses from 10% of sales to 5% of sales, they could perhaps breakeven.

Even in a world where Chewy reaches $10 billion of sales and manages to turn a profit, the valuation should be relatively meager. General merchandise retailers like Costco, Target, Wal-Mart, and Best Buy all trade for less than 1x annual sales in the public market. This is because margins are relatively low (EBITDA less than 10% of sales) and retailers tend to trade at or below market multiples because they are simply middlemen/resellers of products that someone else makes.

Will the share of pet care continue to move in the direction of online e-commerce transactions? Almost certainly. Will Chewy be forced to price very competitively to win share from Target, Amazon, and Petco? Absolutely. Will they be able to ever make big profits by selling cat litter online and shipping it to your house? Of course not.

If Chewy trades at 1 times annual sales five years from now, it has to grow its business by28% annually during that time to be be worth today's price in 2024. For investors who buy it today and expect a 10% annual return over the next five years, Chewy would have to grow 40% per year through 2024.

So is Chewy the next big thing or just the most recent example of an overpriced new IPO? I would bet on the latter and will be paying close attention to see if high valuations persist when many recent IPO are available to short with minimal cost.

Full Disclosure: No position in Chewy at the time of writing

(Author's note added at 6/14/19 12:40p ET - Petsmart bought Chewy in 2017 for $3.35 billion, so they are sitting on a 5x return in 2 years, to give readers a sense of the valuation inflation going on here)

Not Enough U.S. Cash Burning IPOs for You? Here Comes China's Luckin Coffee

Just as U.S. investors are trying to make sense of the Uber (UBER) and Lyft (LYFT) IPOs, both disastrous for those buying at the offer prices, on Friday we will get a U.S. listing of Chinese-operated, Cayman Island-incorporated coffee upstart Luckin Coffee. How much should investors pay for this so-called Starbucks of China (even though its business model is not copying the Seattle-based giant)? Quite frankly, who the heck knows? If that is not a sign that one should pass for now, I don't know what is.

Below is a summary of Luckin's financials from the IPO prospectus, though keep in mind its operating history is short (having gone from zero to 2,370 stores between October 2017 and March 2019).

LuckinFinancials.png

This income statement reads like a Silicon Valley cloud-computing start-up, not a Chinese bricks and mortar coffee chain

As you can see, Luckin's stores are run at a loss, with Q1 2019 sales of $71 million dwarfed by direct store operating costs of $83 million and another $25 million of marketing expense.

Investors should not exactly be enamored with Luckin's growth rate. After all, selling coffee at a loss is an easy way to rack up sales and there is no way that the company has a detailed, refined, and proven unit expansion plan in place given that they are opening these money-losing locations as fast as humanly possible (an average of more than 4 new stores a day since they launched 18 months ago!).

None of this says anything about the long-term odds of success for Luckin Coffee. They could very well become China's largest coffee seller and make money doing it. There is simply no way to know at this point, so investors are left deciding whether they want to take a gamble or not. Many will given that the company will list on a U.S. exchange this week, but with no sound financial model to back up the prices being paid for the shares, there is really no fundamental case to be made for buying the stock.

All one can do is estimate what they think margins could ultimately be based on the business model, assume long-term success, and calculate an imputed price-to-sales ratio worth paying today given certain growth assumptions. That is how Uber and Lyft are likely to be valued (assuming people care to value it at all), and the same idea applies to Luckin Coffee and whatever the next cash-burning IPO waiting in the wings happens to be.

Author's note: To give you an example, assume that Uber can ultimately earn 20% EBITDA margins over the long-term and one can justify paying 15x EV/EBITDA given their potential growth outlook. That valuation equates to an EV/sales ratio of 3x, which based on 2020 revenue projections could yield a per-share fair value in the $30 ballpark (vs today's quote of $40).And don't even ask me to guess what Luckin Coffee's margins could be.

What A Difference A Decade Makes!

There was a lot of talk on CNBC this week about the trailing 10-year returns of the S&P 500 index and what, if anything, they tell us about the duration of the current equity bull market. Interestingly, the U.S. stock market bottomed at 666 on March 6, 2009, and has since returned nearly 18% annually for a decade.

The consensus view is that periods of strong market returns are often bookended by low valuations on one side and high valuations on the other side. That is certainly the case in this instance, and I am not sure it tells us very much about the current bull market (in terms of when it loses steam). Using the intra-day bottom during the worst market environment in nearly 100 years, as a starting point, is almost assured to subsequently produce a decade of strong returns.

While we cannot use this data to predict the next bear market, it is noteworthy that the market does tend to go in cycles that last one or two decades. The last 10 years have been characterized by strong index returns, and the rise of the index fund as the go-to investment option for individual investors. But I would argue that recency bias is playing a large role in this trend.

Consider that from January 1, 2000 through December 31, 2009, the S&P 500 went from 1,469 to 1,115, a loss of 24%. Dividends made up for a lot of the decline, such that $1 invested in the index including dividends was worth 91 cents in the end, but still, that decade produced a cumulative loss of about 1% annually.

Perhaps that is why there were not nearly as many people piling into index funds 10 years ago. They work... until and unless they don't. Just as the economy and the equity market are cyclical, so to will be the popularity of index funds.

Interestingly, even Warren Buffett (arguably the greatest active portfolio manager in history) has been bitten by the index fund bug, having recommended them many times in recent years.

Side note: I think the saying "do as I do, not as I say" is fitting here. While Buffett now praises the index fund category, it is important to note how the 88 year old plans to transition his stock picking duties at Berkshire Hathaway when he is no longer around. Move all of his investments into index funds? Hardly. Instead, he has hired two hedge fund managers, Todd Combs and Ted Weschler, to take over management of Berkshire's stock portfolio. Fascinating.

So what can we expect over the coming decade for the stock market? Well, it is not exactly going out on a limb to say that returns will likely average less than +18% and more than -1%, but that is a start. After all, the coming decade is unlikely to be as good as the go-go 1990's, or as bad as the ten years immediately following them.

History would tell us that average returns will be somewhere in the single digits. I won't hazard a guess as to whether we get 3%, 5%, or 7% a year, but I think mid single digits is as good of a guess as any based on historical data. It will be interesting to see if, in such an environment, index funds remain the asset of choice, or if tastes shift to something else (and if that something else is already in the marketplace or if it has yet to be created).

U.S. Stock Market Seems Like An Obvious Buy For First Time In A Long Time

With the S&P 500 index now down roughly 18% from its peak reached about three month ago, for the first time in years it appears the U.S. stock market is severely oversold and pricing in worse than likely economic conditions. In the two weeks since my last post discussing valuation, the S&P trailing price-to-earnings ratio has dropped by more than a full point and now stands at just above 15x.

I have previously posted that we should expect P/E ratios of between 16x and 17x with the 10-year bond yielding in the 3-5% range (current yield: 2.75%). Given that 2018 corporate profits are pretty much in the books already, the current valuation of the S&P 500 assuming ~$157 of earnings is 15.3x (at 2,400 on the S&P 500).

Let's consider what this valuation implies. First, it presumes no further earnings gains, or put another way, 2018 is the peak of the cycle for profits. Could that be possible? Sure it could, but right now that is the base case. And even with that base case, stocks are 5-10% below the 16-17x P/E we would expect to see.

One could also make the argument that U.S. stocks are pricing in a mild, normal recession. Let's assume a typical 6-9 month recession occurs over the next 12-24 months, and as a result, S&P 500 profits drop 11% to $140. If a normalized P/E ratio would be 16-17x, I would guess stocks would fetch about 18x trough earnings during a recession (investors often pay higher multiples on depressed earnings). If we assign an 18x multiple on $140 of earnings, we get an S&P 500 target of 2,520, or 5% above current levels.

If we take a more bearish stance and assume a normalized P/E (16.5x at the midpoint, given low interest rates) on that $140 profit number, we would peg the S&P 500 at 2,310, or less than 4% below current levels.

I am not in the game of predicting short-term economic paths or stock market movements. All I can say now is that stock prices for the first time in many years are pricing in several of the most likely economic outcomes (normal recession or materially slowing GDP growth). Furthermore, it appears that the S&P 500 will close out 2018 at the lowest valuation since 2012.

Given those conditions, I am aggressively buying stocks with the majority of current cash balances in the accounts of those clients who are aiming for more aggressive, long-term, growth-oriented investment strategies. Put simply, I am seeing a ton of bargains right now and am not content waiting for further downside to pounce. For those who have excess cash on the sidelines, now could turn out to be a great time to add to your equity exposure, assuming that fits with your risk tolerance and investment goals.

With The Elevated Valuation Issue Solved, 2019 Earnings Growth Takes Center Stage

With S&P 500 profits set to come in around $157 for 2018, the trailing P/E ratio for the broad market index has fallen from 21.5x on January 1st of this year to 16.5x today. Surging earnings due to lower corporate tax rates have allowed for such a significant drop in valuations despite share prices only falling by single digits this year, which is a great result for investors. Normally, a 5 point drop in multiple requires a far greater price decline.

With sky high valuations now corrected, the intermediate term outlook for stocks generally should fall squarely into the lap of future earnings growth in 2019. On that front, there are plenty of headwinds. With no tariff relief in sight, the steady inching up of interest rates, a surging federal budget deficit, and no incremental tax related tailwinds next year, it is hard to see a predictable path to strong profit growth from here.

Even if 10-year bond rates go back into the 3's, market valuations should stabilize in the 15-18x range, so stocks today appear to be fully priced for a relatively stable economic environment. Although current profit estimates for 2019 are quite high (double digit growth into the $170+ area), I suspect those figures will come down meaningfully once companies issue 2019 guidance in late January and into February (analysts don't often go out on a limb so they will wait for companies to tell them what to expect).

Putting all of this together and we are unlikely to make new highs in the market anytime soon, in my view. We probably have 10% downside and 10% upside depending on various economic outcomes over the next few quarters. In the meantime, there are plenty of cheap stocks to accumulate and hold for the long term, until attractive exit points present themselves. Goldman Sachs (GS) is a perfect example, at it inexplicably trades for $176 today, below tangible book value of $186 per share.

Full Disclosure: Long GS at the time of writing, but positions may change at any time.

Rising Interest Rate Shock: 2019 Edition

Back in February I published the table below to show investors where the S&P 500 index would likely trade if interest rates normalized (10-year bond between 3% and 5% is how I defined it):

SPX-scenarios.png

Published 2/27/18

The point of that post was to show what the typical equity valuation multiple was during such conditions (the answer is 16x-17x and we don't have to go back too far to find such conditions). Now that 2018 is coming to an end and earnings are likely to come in at the high end of the range shown in that table ($157 is the current consensus forecast), let's look ahead to 2019.

I have added a gray section to the chart (see below) to include a range of profit outcomes for 2019. The current forecast is $176 but I believe there is more downside risk to that than upside, so I did not add any outcome in the $180+ area.

SPX-scenarios-Oct2018.png

As you can see, the equity market today is adjusting rationally to higher rates, with a current 16.1x multiple on consensus 2019 profit projections. The big question for 2019, therefore, is not huge valuation contraction. Rather, it comes down to whether earnings can grow impressively again after a tax cut-powered 26% increase in 2018. If the current consensus forecast for earnings comes to fruition, the market does not appear to be headed for a material fall from today's levels.

Given that the long-run historical average for annual earnings growth is just 6%, assuming that in the face of rising rates the S&P 500 can post a 12% jump in 2019 seems quite optimistic to me. Frankly, even getting that 6% long-term mean next year - resulting in  $166 of earnings - would be solid.

For perspective, at that profit level, a 16x-17x P/E would translate into 2,650-2,825 on the S&P 500, or 3% lower than current quotes at the midpoint. Add in about 2% in dividends and a flattish equity market overall seems possible over coming quarters if earnings fall to post double-digit gains next year and valuations retreat to more normal levels.

Would Moving To Six Month Financial Reporting Solve Anything?

News that President Trump has asked the SEC to study the potential benefits of moving from quarterly to biannual financial reporting for public companies has stoked a debate as to the merits of such a proposal.

While it is certainly true that short-term thinking, often motivated by the desire to please Wall Street, should not be a focus of management teams of public companies (I can’t stand it when I see quarterly financial press releases tout how actual results beat the average analyst forecast), I am not sure that six-month reporting would materially help solve the problem. From my perch, there are several reasons why I would not expect much to change if such a proposal was enacted:

  • Many companies already do not spend time predicting or caring about short-term financial results, and those firms adopted such a strategy on their own. They did so because the boards and management teams of those firms decided it was the best way to run their business. Those calls fall under their job descriptions, and they take them seriously regardless of what guidance they receive from regulatory bodies.

  • For companies that choose to give forward-looking financial guidance today, they would likely continue to do so on a six-month basis. If they tried hard to hit their quarterly numbers, sometimes doing so at the expense of longer term thinking, the same would be true when dealing with six-month financial targets. Behavior would not change, just the outward frequency of such behavior would.

  • Reducing the frequency of financial reporting would only serve to make companies less transparent with their own shareholders. Since we are talking about public companies that are serving their shareholder base first and foremost, it should be up to the investors to voice concerns about what metrics are being prioritized at the management and board level. There is a reason activist investing has found a place in the marketplace (and the goals are not always short-term in nature, despite media claims to the contrary).

  • Just because companies are required to file quarterly financials does not mean they need to spend much time on them, or communicating them. Jeff Bezos likes to brag to his shareholders at Amazon's annual meetings that the company has no investor relations department and does not travel around the country to tell their story to the investment community. He does not think it is a good use of his time. Plenty of smaller firms simply file their 10-Q report every 90 days and hold no conference call to discuss their results. In essence, they spend minimal time on financial reporting (10-Q reports are not super time consuming when the same template is used every quarter and the company has to close their books every period regardless of external reporting requirements).

  • There is an argument that less frequent financial reporting will result in more volatile stock prices when companies do publish their financials. Essentially, if things are going unexpectedly, the surprise could be twice as large if the gap between reporting periods is twice as long. For many companies, this might be true. But I am not sure of the net impact, given that it can work the opposite way too. If a company has a poor Q1 but makes it up with a strong Q2, it could be a wash when it comes time to report mid-year results, whereas quarterly reports would have resulted in surprising investors twice, in opposite directions.


    It seems the core problem people are trying to solve here is the focus on windows of just 90 days from a management and investor perspective. I firmly believe that whether a company takes a long term view, at the possible expense of short-term results, or not, that decision is a reflection of top management and the board, with input from shareholders hopefully playing a role. If that is true, then reporting frequency itself is not the core determinant of the behaviors we see. As such, we should expect companies to continue their chosen management styles and strategies, whether they have to publish financial reports every 3, 6, or even 12 months.

    From an investor standpoint, if I am going to be given information less frequently, I would want to at least believe that performance will be superior, in exchange. In this case, I do not see how six-month reporting would benefit shareholders by changing behavior at the corporate level, leading to improved revenue and earnings growth over the long term.

    If a simple financial reporting rule change would dramatically change decision making inside public companies, then the same managers who are pushing for six-month reporting should take responsibility for how they are running their companies and simply de-emphasize short term results.

    They can do so without rule changes at the SEC, and they can go further if they want. For instance, there is no rule that says you need to host quarterly conference calls after reporting earnings. Companies could easily host one or two calls per year if they chose to (or none for that matter), which would send a clear message to their investors and free up time (albeit not that much) to focus on the long term.