
The U.S. stock market has been skittish lately, largely on fears of higher interest rates. As new Fed Chairman Jerome Powell takes over for Janet Yellen, and Congress passes multiple pieces of legislation that will swell the budget deficit, investors are getting more nervous about higher rates.
What is amazing about this dialogue is that a 3% yield on the 10-year bond is scaring some people, whereas throughout history 3% would look like a dream come true for equity investors. The issue, of course, is that a 3% 10-year yield is only problematic when the market's valuation has been elevated due to such low rates. It does not really matter if 3% is still low, but rather, if 3% is higher than the 1.5-2.5% range we have seen for many years now.
So let's assume that rates are heading higher and a sub-3% 10-year bond will become a thing of the past over the next year or two (I will not even hazard a guess as to exact timing). The S&P 500 ended 2017 trading at more than 21x trailing 12-month earnings, so that multiple will need to come down as rates rise. But by how much?
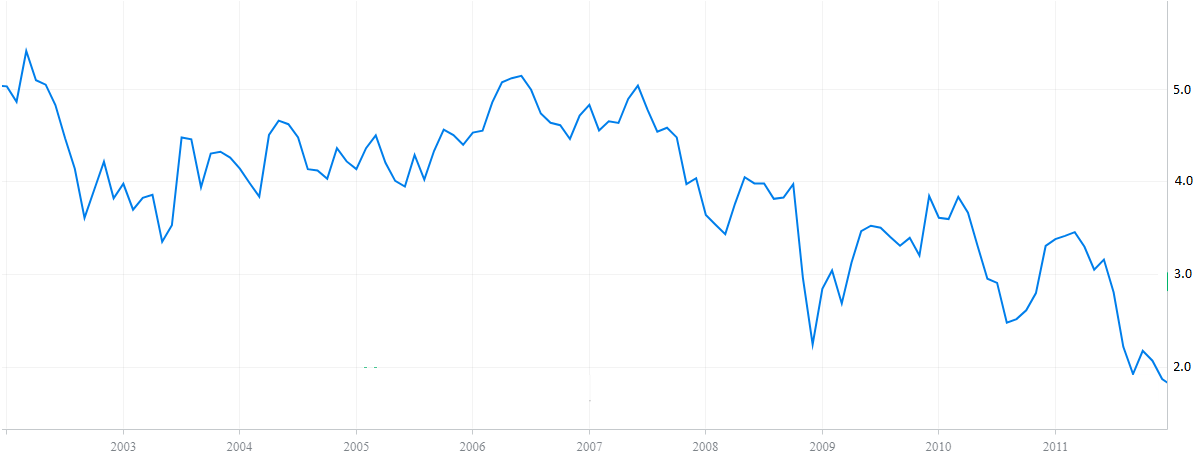
Fortunately, we do not have to go back very far in time to find instances of the 10-year bond trading in the 3-5% range. In fact, from 2002 through 2010, it traded in that range most of the time:
During that near-decade long period of time the S&P 500 index traded for between 13 and 20x trailing earnings, with the mean and median both coming out to around 17x. If we use price-to-peak earnings ratios (to smooth out earnings volatility due to the economic cycle (P/E ratios are artificially high during earnings recessions), the mean and medians are around 16x.
So it is fair to say that a more normalized interest rate environment could bring P/E ratios down to around 16.5x, on average, with the 10-year bond yielding 5% or less, but more than it does today. Well, that tells is a lot about where stock prices could trend in coming years. Consider the table below:

The consensus forecast for 2018 S&P 500 earnings is about $155 but that could prove a bit optimistic (companies are always very positive about their go-forward prospects when a new year begins). Above I showed a range of $145-$155, which would still represent strong year-over-year growth of 20% at the midpoint (due largely to the recently enacted tax cuts).
You can see that if P/E ratios were to come back down to the 16-17x range, assuming the 10-year yield moved towards 4% by year-end 2018 on the back of 3-4 Fed rate hikes), the U.S. market could be in for some sideways to slightly down price action. Today the market trades for about 19x the current $155 earnings projection.
The good news is that valuation and interest rate normalization should not, in and of itself, be hugely detrimental to stock prices as long as earnings hold firm. Assuming no recession, my worst case scenario would probably be a 16x multiple on $145 of earnings (S&P 500 at 2,320), which while not a fun path to take, would only represent about 8.5% additional downside relative to the market's recent low earlier this month. That is not exactly a super-scary outcome, and it probably is not even the most likely base case scenario. Buyers could easily come in at 17x earnings and if profits reached $150 this year, that would mean we have already seen the low point for the S&P 500 this year.