Is Total U.S. Credit Card Debt Really Over $1 Trillion and Should We Be Concerned?

Recession forecasters tend to jump on any financial datapoint they can find to justify their predictions of imminent financial doom and one of the those that bothers me the most is definitely our “record level of credit card debt.”

Here is a chart from a CNN article over the summer titled Americans’ credit card debt hits a record $1 trillion:

Before we get too concerned, consider the following:

1) Credit card “debt” is measured by simply combining all of the balances of every active card in the U.S. at any given time. So, if you use a credit card for everyday spending in order to get rewards and delay the cash outlay for the stuff you buy, that is considered “debt” even if you pay the balance in full every month and never owe a dime of interest. Considering how many people do this every month, and what percentage of overall credit card spend would come from such consumers, it is highly misleading to characterize every dollar of credit card balance each month as “debt.”

2) The financial media usually highlights the total amount of this so-called debt because it’s a big number. $1 trillion!!! Far more helpful would be per-capita data since the country’s population grows each year. If you don’t make that adjustment, most years will be a new record high.

3) As many financial professionals out there know, debt is one thing (sorry, for this one I am going to pretend the entire $1 trillion+ is debt) but what really tells the story of overall financial health is both assets and liabilities, income and expenses. Having debt is not a big deal (sometimes even quite beneficial) if your assets and income can easily support it.

With those ideas in mind, let me reframe the chart shown above to put credit card “debt” in better context:

a) Although total credit card balances have grown by 56% from 2013-2023, the U.S. population has grown by 24 million people during that time. Thus, on a per-capita basis, credit card balances average $3,029 per person in 2023, up only ~45% since 2013 ($2,089 per person).

b) As previously mentioned, the $3,029 figure does not represent true debt like a student loan or auto loan balance would. I don’t have data to indicate what fraction of card balances are carried over month-to-month, but it is safe to assume it is materially lower than $3,029.

c) How do we know if credit card spending has really been growing at problematic rates? Easy, let’s look at income data. According to the U.S. Department of Housing and Urban Development, median family income nationally has grown from $64,400 in 2013 to $96,200 in 2023 - an increase of 49%.

To summarize, $1 trillion in total U.S. credit card balances might appear to be concerning in the absence of any other information. If we adjust the data for population growth and compare it to income growth, we see that over the last decade incomes have risen 49% while credit card balances have risen 45%. Additionally, as credit card rewards programs have become more engaging over the last decade, it has become more common for consumers to use cards as a way to benefit financially by using them for most purchases and paying their balances off each month.

And so, there doesn’t appear to be a credit card debt problem at all.

That is not to say we will avoid a recession in 2024 (nobody knows that) - but rather simply that credit cards will not be a contributing factor if we don’t.


How Well Will Earnings Hold Up? Watch The Job Market...

With corporate profits set to fall for calendar year 2022 (final results won’t be known for weeks), the big question for equity investors is whether 2023 will bring stability on that front or not. Wall Street strategists largely expect another decline as economic headwinds accumulate, but the sell side is staying rosy (current consensus forecast is earnings growth of ~10%) and likely will continue that stance until companies explicitly give them 2023 guidance because they have very little reason to go out on a limb and make their own forecasts.

The economic and investment climate today reminds me a lot of 2015-2016. Back then earnings also showed a year-over-year decline (2015) during a time when overall economic indicators remained bright. The U.S. unemployment rate fell that year, and GDP growth actually accelerated. The biggest culprit for profits was energy prices, which fell dramatically and sparked a wave of financial distress for much of that sector and the lenders who funded their operations. Fortunately, the energy bear market eventually resolved itself through normal supply and demand rebalancing and overall U.S. corporate earnings rose in 2016 and set a new record in 2017. The result was only a single down year for the U.S. stock market.

From my vantage point, tech is the new energy in this comparison. The pandemic brought forward a ton of growth for digital businesses and now that pent-up demand is waning, growth has slowed materially (going negative for many companies) and layoffs are mounting. But as was the case back in 2015, the rest of the economy is pulling its weight just fine. There are labor shortages in many areas, which has resulted in the U.S. unemployment rate actually dropping over the last 12 months (4.0% to 3.4%) despite the Federal Reserve raising the Fed Funds interest rate by a stunning 450 basis points during that time.

You can tell the stock market isn’t really sure what to make of all this. After a sharp drop in 2022, this year has started with a bang as earnings are holding up so far and GDP growth remains in the black with more jobs created every month. The thesis that corporate profits fall in 2023 may still play out, but the timetable on which that becomes obvious keeps getting pushed out, which means stock prices can start to discount the possibility that such a scenario doesn’t materialize (what we are seeing this week).

I think watching the job market is the key. What if we can get through a full rate hiking cycle with the unemployment rate staying below, say, 5%, and most of the firings come from big tech companies? Could most of those workers find new jobs with “smaller and older” tech businesses who previously couldn’t compete with posh offers from the likes of Google and Facebook? If so, we might just see a soft landing after all. With the consumer always the main driver of the U.S. economy, they will tell the story this cycle as well. Without strong incomes, the negative impact on the bottom lines for lenders and sectors like hospitality, retail, and entertainment becomes a downhill wipeout.

Where do I think we wind up? Hard to say, but I definitely think the current 2023 earnings forecast of $223 (versus $200-$205 for 2022) is overly optimistic. If we can’t push much past $200 with the current backdrop today’s S&P 500 quote of 4,100+ appears quite rich with a 3.5% 10-year bond yield. For the bullish scenario to play out we would probably need to see growth in 2023 (say, $210+) with a clear path towards an acceleration in 2024 to $230+ (after all, 18 times $230 equates to 4,140 on the S&P 500). Buckle your seatbelts… if January was any indication the range of outcomes is quite wide.

Could Corporate Profits Hold Up Better This Cycle?

If the pandemic has taught us anything I think it is that this economic cycle is unlike any others we can point to in history given the uniqueness of how the entire globe has had to react to Covid-19. The investment community tends to try and predict current trajectories with those of prior cycles, and I am no different. In fact, in my latest quarterly letter to clients I pointed out that during the last four recessions S&P companies saw profits fall between 20% and 40% peak to trough. Coupled with near-certain multiple compression, it is easy to see how and why stock prices get walloped during recessionary periods, even if the drops are relatively short-lived in the grand scheme of things.

So here is where I am going to through a wrinkle into the discussion. What if things play out a little bit different this time? I doubt we can avoid a recession at this point, given that Q1 GDP was negative (due solely to a lack of exports by the way - entirely pandemic related). Q2 GDP could easily put us into a recession. In fact, the Atlanta Fed’s real time estimate for Q2 is currently showing a negative reading, so that ship might have sailed already. So what would be different this time? Well, what if corporate profits hold up better than in recent prior cycles, which could serve to cushion the downturn in stock prices a bit and help spring a fairly quick recovery?

There are a few factors that I think could play into this thesis. First, Q1 earnings actually rose year over year despite negative GDP growth. Current forecasts call for another (small) increase for Q2 despite a possible negative GDP print. So that’s interesting. Even if second half 2022 profits fall versus 2021, it would take quite a big impact to see the typical 20-40% decline from 2021’s record profit level.

There are multiple tailwinds to earnings this cycle that have not been big factors in recent decades. Strong energy prices relative to what we would normally see in a recession? Check. High inflation that keeps revenue figures elevated as long as customers don’t balk at buying? Check. Interest rates that are rising rather than falling, which would actually help the bottom lines of many financial companies? Check. A historically tight labor market that might result in the unemployment rate rising less during this downturn that prior ones? Check. Relatively limited supply of housing units relative to demand that could limit any glut/price collapse for both owned and rented properties? Check.

Look, this is just a thesis that seems like it has a bunch of bullet points going for it. I have no idea if we actually see corporate profits only decline 10 or 15% this cycle versus 20-40% historically. But if one is feeling a tad more bullish than many headlines would indicate, there are green shoots to point to.

I also wonder if this is why the P/E for the U.S. stock market remains near historical averages for a mid-cycle climate (16-17x) rather than a recession (10-14x). If a recession comes but profits hang in there, there might not be a reason for stocks to ever trade that low. So maybe the market is expecting profits to hold up rather well, just as I am postulating. Of course, the flip side of the argument is not reassuring (i.e. if this thesis is wrong maybe another big leg down is coming).

Needless to say, I am more interested in watching profit numbers than I am GDP or CPI going forward. While I agree estimates need to come down from current levels, I want to see by how much. I think that will tell us whether the worst for the market is behind us, or if 2022-2023 is going to play out similarly to 2001/2008/2020.

For those who will be doing the same, here is where the numbers stand as of today for S&P profits:

2021 CY: $208 (all-time record, 32% above 2019’s $157)

TTM Q1: $210 (+40% yoy)

2022 Q1: $49 (+4% yoy)

2022 Q2: $55 (estimate, +5% yoy)

2022 CY: $223 (estimate, +7% yoy)

RIP: Gold

I find it pretty amazing that 2021 did not turn out to be “the year of the gold bug.” You know the long-standing argument for the precious metal; huge deficit spending by the government leads to surging inflation, which in turn leads to a tremendous performance for gold - cementing its place as the dominant inflation hedge. Well, the consumer price index is setting up to exceed +6% for the year, the highest inflation rate in several decades. So let’s pop the champagne for the gold bugs as their bet finally paid off in spades:

Oh. Nevermind, I guess. Couldn’t even muster a gain of any kind this year.

The nail in the coffin for that strategy, I suppose. Hopefully that moment came a long time ago for many people.

The inflation hedge argument never really made sense to me. Over my lifetime, gold has compounded at about 4% annually versus the CPI at about 3%. Store of value? Sure. A hedge against inflation? Not so much, given that its track record is roughly the same as, well, most everything. It would be like saying U.S. small caps are a good hedge against U.S. large caps (the former narrowly outperforms the latter, on average, over the long term). Not a very compelling argument.

So why hasn’t gold done well this year? Others probably have more insight into that than I do, as I neither own gold personally nor in client portfolios. But I will say that I don’t really think demand for gold has anything to do with inflation. The supply of gold is fairly stable and predictable and the same can be said for demand (fairly narrow uses that don’t shift much year to year).

As we have seen in 2021, inflation really boils down to “too much money chasing too few goods.” In other words, strong demand coupled with constrained supply. You seem to need both to be true for prices to materially move above trend. Budget deficit hawks have been predicting inflation for a couple decades now, as government spending has surged this millennium, but price increases actually decelerated (globalism has only eased any potential supply constraints, such that strong demand has been met adequately).

Only with the pandemic and its impact on supply (of materials and labor alike) have prices surged. So within the commodities market, those raw materials that have seen the bigger supply disruption, and that are simultaneously used in the manufacturing of more “stuff,” have seen the biggest price increases. If anything, those are the inflation hedges.

While I suspect the inflation hedge argument will lose steam coming out of 2021, it will remain a part of portfolios for many managers going forward. Despite a down year, the long-term track record still suggests gold is a store of value. It also continues to have a low correlation with other asset classes, if not strong absolute performance, and that will be useful for investors looking to hedge a diversified portfolio over short periods of time. Over the long term, however, allocations to gold are likely to continue to be a drag on overall portfolio performance.

Maybe We Should Resist Panicking Over Inflation Until Mid-2022

It should never surprise us how short-sighted financial market participants and economists are, given that they all make their living by making moves or commenting on the moves of others on a daily basis. And yet, I am still disappointed that the recent talk of elevated inflation has not been met with more context. Yes, I know that the consumer price index (CPI) rose by 6.2% in October, the largest increase in decades, but why do we never hear about how that compares with 2020 or 2019?

Corporations have been quick to compare 2021 financial results with 2019, the so-called “two-year stack,” because everybody knows that 2020 was an anomaly in terms of sales and profits. Why no talk that maybe 2021 was also an anomaly in terms of inflation?

It reminds me of when people freak out every time gas prices at the pump spike temporarily. Oh my goodness, can you believe gas is $4 a gallon some places in the country? Somebody has to do something about this out of control inflation right away, they say. In reality, gasoline prices have been lagging overall inflation for decades. They should be the last item people complain about when it comes to price increases.

According to the U.S. Energy Information Administration, retail gas prices today average $3.30 per gallon. Ten years ago it was $3.31. The U.S. hit $3 for the first time right after Hurricane Katrina, more than 16 years ago. Yes, gas prices tend to be volatile and thus when you look peak to trough periodically increases will look gigantic. But if you look at the longer term data, gasoline has actually been a relative boon for consumers’ wallets.

Unsurprisingly, the same logic extends to inflation. Focusing on just the CPI figure for October 2021 ignores that for the 2 years before that, October CPI has averaged 1.5%, for a 3-year average of +3.1% (hardly something to be overly concerned about).

Given that in any single year these inflation figures, whether it be for a single item like gas or the entire basket, can be volatile, I think multi-year trends are key. It’s one thing if we get 5% inflation for a year and then it recedes. It’s entirely another if we get that level of price gains for 2-3 years straight.

So when do we start to lap what very well could be one-time pandemic-related spikes in the CPI? Not until the spring of 2022 (the CPI first hit 5% in May 2021). If we get another 5% print this coming May, okay, maybe there is something more going on here that has a long-lasting impact. But if we get a 3% print in May 2022 and 1-2% in May 2023, history will have once again played out as it usually does, with mean reversion telling a completely different story than a single isolated data point.

I suspect that is what Fed Chair Jerome Powell is thinking when he downplays the risk of longstanding inflation well above historical trends. I think it is more likely than not that we see a similar outcome this time around, though zero interest rates are probably still not the correct policy decision.

Are Financial Markets Getting Even Less Predictable in the Near Term?

Earlier in my investment management career it was not uncommon for me to raise a fair amount of cash, say 10-20%, in client accounts when I thought the equity market was overheated. The idea was that I would have plenty of firepower when prices dropped and bargains were abundant. Over the years the data suggested that such a move was rewarding, at best, half the time. Too many instances, though, resulted in prices rising enough before they fell that the cash positions at best offered no alpha.

Don’t get me wrong, I have always been in the camp that market timing in the near term is difficult (hence I would never go to 50, 75, or 100 percent cash), but I learned that mean reversion, while a real thing, could not really be consistently exploited profitably even on just a small part of a portfolio. As a result, cash balances in my managed accounts now reflect the number of interesting investing opportunities I see out there, rather than overall market levels.

As I have spoken with clients this year, I think 2021 has solidified the argument against market timing even more, if that’s possible. Profits for S&P 500 companies this year are currently on track to come in roughly 30% above 2019 levels. And that result has not happened because the pandemic suddenly waned. In fact, we are seeing a lot of data that would suggest corporate profit headwinds; retail supply constraints, a lack of qualified labor, and a chip shortage - to name a few - all of which are profit margin-negative.

Despite such strong profit growth, interest rates remain very low with the 10-year bond yield hovering below 1.5%. The end result is an S&P 500 that fetches 23 trailing earnings after surging for most of the year. Who would have been able to predict that? It seems to me even fewer people than would have done so in more normal economic times.

The current inflation story reinforces the point even more; that short-term market movements are getting even less predictable than in the past. And that’s certainly saying something. We just learned today that consumer prices rose by more than 6% in October, a 30-year high. Remember how one of the main jobs of the Federal Reserve is to raise interest rates to keep inflation subdued? Would any short-term investment strategist suggest that 6% inflation would not result in higher interest rates and thus lower stock valuations? And yet, here we sit with the Fed Funds interest rate sitting at zero. Not just an average rate. Not just a below average rate. But zero.

I didn’t come into 2021 trying to predict the economy and the markets and thank goodness for that. For those who still do try that sort of thing, I think 2021 has taught us that a very tough job is getting near impossible, if it wasn’t there already.

So what to do? Throw up our hands, of course. But in conversations with clients I find myself saying “I have no idea” more often than ever. Some may find that disappointing, especially coming from an industry professional, but if my track record predicting stock prices, interest rates, or other economic metrics six months out was unimpressive before the pandemic, imagine how subpar it would be now. I much prefer to just sit back and try to invest in undervalued companies regardless of the macro backdrop and I think my clients are best served by that as well.

Virtual Annual Meetings and Premature Bankruptcies

A list containing the number of ways this recession is unique is quite long, which is making navigating these waters as an investor much more difficult. While unrelated, below is a brief mention of two that are on my mind.

1) Virtual annual meetings

With in-person annual shareholder meetings cancelled, every investor can now attend meetings online without booking a flight and a hotel. Not all meetings are created equal. Some have long Q&A sessions for shareholders and in-depth slide decks, while others stick to business and offer little in the way of helpful data points for investors. So while it may be a hit and miss activity, for those companies you follow closely and are contemplating adding or shedding shares, look to take advantage of virtual meetings this year.

2) Premature bankruptcies

Navigating the corporate bond and preferred stock markets these days is really tough, as liquidity and solvency are tougher to drill down. Making it even harder is the fact that many companies appear ready to file Chapter 11 before they need to. They probably figure that the pandemic offers a great excuse and management can keep their jobs after the businesses emerge. Why not take the opportunity to clean up the balance sheet and be stronger coming out of this?

Consider Diamond Offshore, an offshore oil driller than just filed. The company disclosed assets of $5.8 billion of assets, $2.6 billion of debt, and cash onhand of $435 million, according to Bloomberg. In addition, DO announced that they do not need any debtor in possession financing and will use existing cash to operate while proceeding through court. I cannot recall a time when a company has filed with so much cash onhand and didn’t need a loan to continue operating. And they are not alone, JC Penney is reported prepping for bankruptcy despite having $1 billion of existing liquidity.

These are truly unique times. Good luck out there everyone.

Full Disclosure: Long puts of DO and JCP at the time of writing, but positions may change at any time

U.S. Unemployment Rate Drops To Historical Average in January

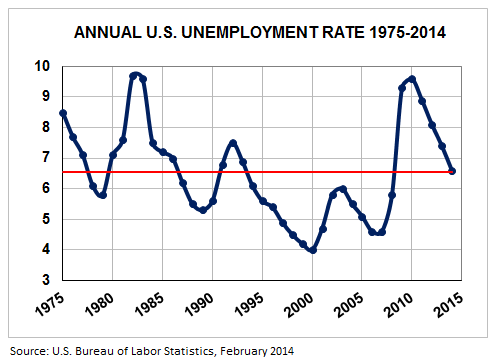
Since the political party in power will always try to spin economic data postively, while the opposing party tries to convince you the country is still in the doldrums, sometimes it's nice to put metrics like the U.S. unemployment rate in perspective by showing historical data without political interference. Accordingly, below is a chart of the unemployment rate over the last 40 years. As you can see we are back down to "average" today (the 40-year mean is the red line), so things are neither great nor terrible. That's surely not what you'll hear as the mid-term elections get into full swing this year, but that's yet another reason why politics and investment strategies shouldn't be mixed. Investing is far more dependent on reality than politics. 40Year-US-UE-Rate-1975-2014

Part Time Workers, Consumer Spending, And The Affordable Care Act

Don't worry, no political arguments will be made here. That is not worth the effort for the author or the readers of this blog. However, since we are focused on stock picking as investors, it is a valuable exercise to dig into the data and determine if there will be a material impact on U.S. corporate profits because of the Affordable Care Act. After all, if consumers' pockets are squeezed from fewer hours worked each week and/or the need to start buying health insurance for the first time, that would definitely impact the sales and earnings of the companies we are invested in. And that could hurt our portfolios.

Since the September jobs report came out this week I decided to take a look and see if the trend than many people fear as a result of the new healthcare law -- employers shifting full-time workers to part-time status in order to be exempt from being required to provide them with health insurance -- has actually started to take hold. Many people have already argued one way or the other, but most of them have political motivations and rely on a small subset of anecdotal reporting without actually looking at the numbers and reporting the truth.

The good news for our investment portfolio is that this trend has yet to materialize. It certainly could in the future, so we should continue to monitor the situation, but so far so good. Last month there were 27, 335,000 part-time workers, out of a total employed pool of 144,303,000. That comes out to 18.6% of all employed people working part-time (defined as less than 35 hours per week). That compares with 26,893,000 part-time employees during the same month last year, which equated to 19.1% of the 142,974,000 employed persons. Interestingly, part-time workers are actually going down in both absolute terms and relative to full-time workers. These numbers will fluctuate month-to-month, but it clearly has not happened as of yet.

The other potential problem with the Affordable Care Act, and more specifically the requirement that everyone buy health insurance, is that discretionary consumer spending could fall as more of one's after-tax income goes towards insurance and is not spent on discretionary items. We should remember of course that consumer spending counts the same in the GDP calculation regardless of whether or not we buy insurance or other things, so there is no overall economic impact. But, we should expect to see consumers allocate their funds differently, which could impact specific areas of the economy (vacationing, for instance).

But just how much of an impact will this have? Will it be large enough to materially hurt the earnings of many public companies? To gauge the overall potential for that we need to dig into more numbers.

About 15% of the U.S. population does not have health insurance. Let's assume 100% compliance with the Affordable Care Act (either via the purchase of insurance or the payment of the penalty for not doing so). Let's further assume that the net negative financial impact of such compliance comes to 5% of one's income (not an unfair assumption based on insurance premiums). That means that approximately 0.75% of consumer spending (5% x 15%) would be reallocated to healthcare and away from other areas. While that is not a big shift, it would be real.

However, the analysis can't end there. We can't simply conclude that approximately 1% of non-healthcare consumer spending will be lost due to the new law. Why not? Because that would assume that every American earns the same income. In reality, those impacted by the Affordable Care Act (the uninsured), are skewed towards lower and middle income folks. Most wealthier people get health insurance through their full-time jobs and will continue to do so.

Now, the bottom 50% of Americans only make 15% of the income earned nationwide. If we factor that point into the equation, then the overall impact on consumer spending goes from quite small (0.75% per year) to fairly immaterial. In fact, it comes out to something around 0.2% of overall consumer spending per year if we assume that the average uninsured person falls into the 25th percentile of total income.

So what is my conclusion from all of this? Well, I own a lot of shares in consumer-related companies both personally and for my clients, and I am not concerned about the Affordable Care Act taking a meaningful bite out of the profits that those companies are going to generate in the future.

CBO Projects U.S. Budget Problem Solved For Now

It's amazing what some tax hikes coupled with spending cuts can do for a $1.1 trillion annual budget deficit (just kidding... actually, it's pretty logical). The Congressional Budget Office (CBO), the leading group of nonpartisan budget number-crunchers, now projects that the U.S. federal budget deficit will shrink by an astounding 41% this year, from $1.087 trillion to $642 billion. The reason? Tax receipts are rising faster than expected. Couple that with budget cuts and the result is a huge dent in the annual funding gap for the federal government.

Even more important than a one-year annual decline is the trend CBO sees for the next decade. Here is a chart of their annual deficit projections through 2023:

deficitsbillions.png

As you can see, the deficit hits bottom in 2015, so this (falling deficits) is not a one-time 2013 event. Now, you may look at the rest of that chart and conclude that the good times will be short-lived, as the deficit climbs back to about $900 billion by 2022. If you are just looking at the absolute numbers alone, that would be concerning. However, we need to remember that the deficit as a percentage of GDP is what matters. Somebody making a $1 million a year, for instance, can afford a $10,000 per month mortgage payment. Somebody making $50,000 a year cannot. The ability to carry debt and service it adequately depends on how much money you have to work with, making the absolute numbers meaningless without context.

So what do the above numbers look like if we look at the deficit as a percentage of annual U.S. GDP? Here is that chart:

deficitspctgdp.png

The key number here is the last bar, which shows that the average deficit over the last 40 years (1973-2012) has been 3.1% of GDP. All of the sudden those later years don't look so scary, even though from 2015 to 2022 the deficit nearly doubles on percentage terms.

Now, it is certainly true that if we do nothing to adjust the long-term Social Security or Medicare payments we are scheduled to make, then the deficit will become a huge problem again down the road. However, it is very important to understand from an investing perspective (and possibly from a political one as well), that over the next decade we really will not have a debt problem as long as current law remains in effect and the CBO's baseline assumptions about the economy are close to accurate. Although plenty of people hated the tax hikes and/or the budget cuts that took effect this year, they are doing wonders for our debt problem. Personally, I'll take longer term gains with shorter term pains anytime, if the alternative is the exact opposite.